
Framework
PublishedThe Fractal Leader
A decision lens: averages can be correct and still hide the risk, opportunity and trust that should change the decision.
- Zoom out → see the system
- Zoom in → see what matters
- Decide what changes
See what averages hide: risk, opportunity, and trust at the edges of relationship-led work.
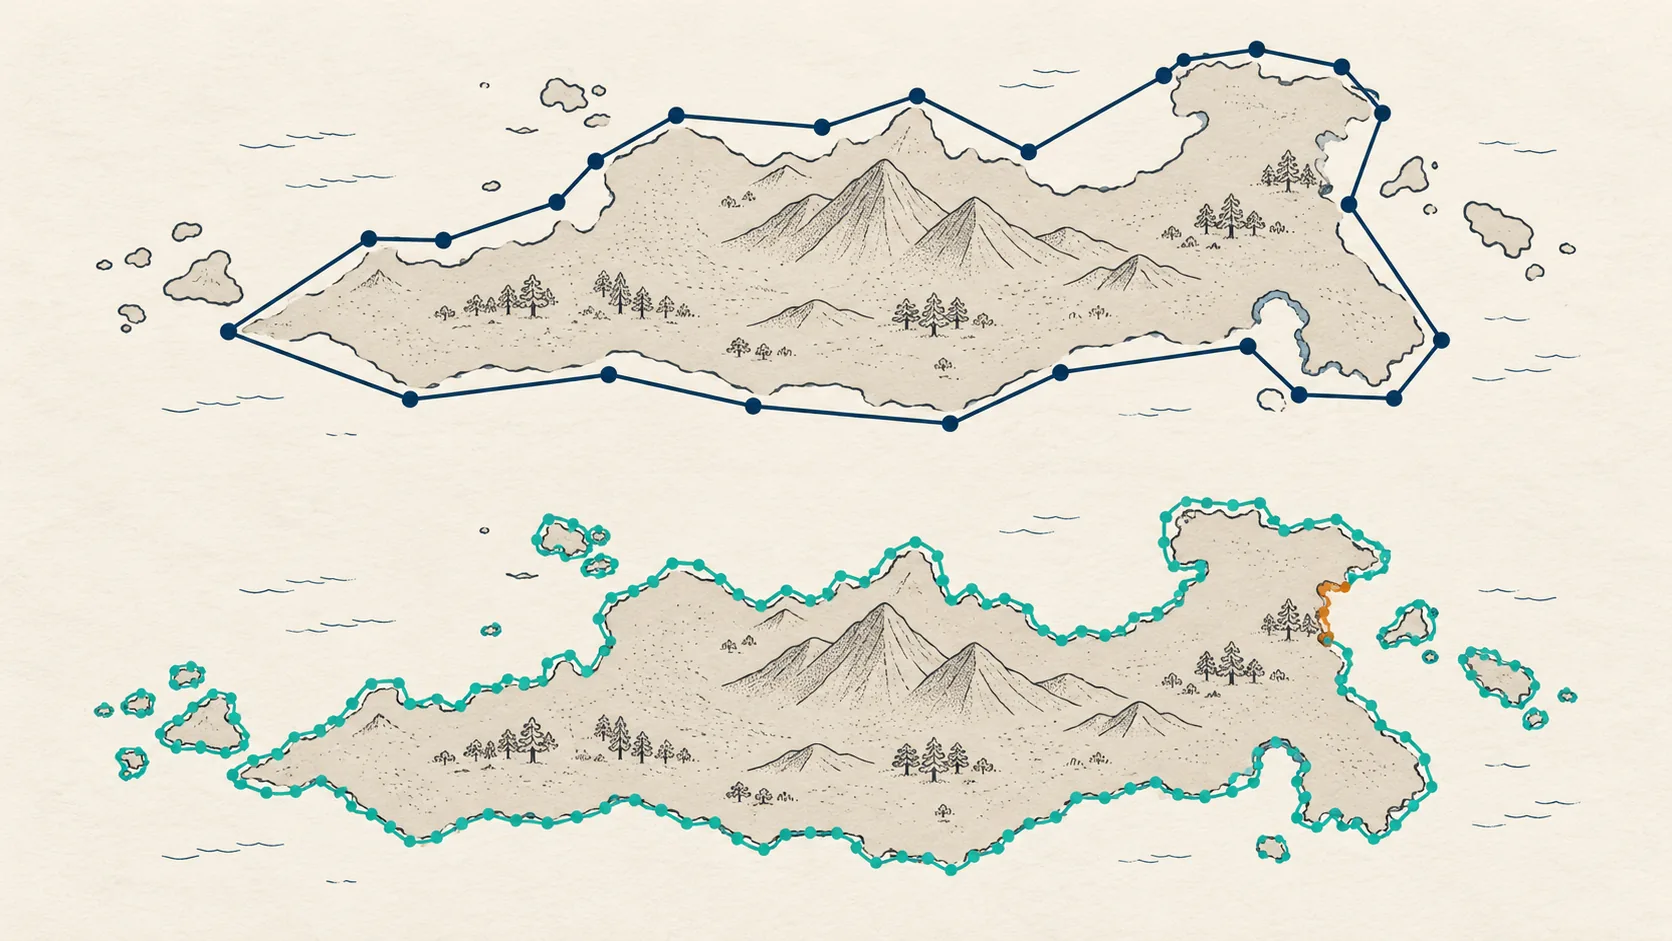
01. The coastline
How long is the coastline of Britain?
It depends on the size of your ruler. Use a large ruler and the coastline looks smooth, short, and predictable. Use a smaller one and it gets longer, more complex. Zoom in far enough and it keeps expanding. There is no single answer. Only a function of how closely you look.
I didn’t understand this when I was younger. I thought numbers told the truth. If the numbers looked good, things were good. If the numbers were improving, I was on the right track. That belief worked, until it didn’t.
What is an edge?
An edge is a meaningful detail, difference, or change that becomes visible when you look beyond the overall picture. It might be a hidden risk, an emerging opportunity, an unusual pattern, or a change in an important relationship.
Not every difference matters. The skill is knowing which ones deserve your attention.
The average is where you feel safe. The edge is where the truth is.
Averages are not the enemy. They help us see trends, understand scale, and make decisions. The problem starts when we mistake the summary for the complete picture. The average gives you perspective. The edges give you context. You need both to make better decisions.
On paper
Everything looked like it was working.
There was a period when I was running my own consulting business, and the numbers looked promising. Some periods were exceptional. Revenue was growing. Opportunities were coming in. From the outside, it looked like I had figured things out.
The edges were telling a different story.
Revenue
Some periods generated exceptional results. The overall numbers suggested strong performance.
Consistency
The individual weeks told a different story. The highs were impressive, but they were not consistently repeatable.
Sustainability
What appeared to be growth from a distance needed a more reliable foundation to sustain it over time.
Then things started to change. Not all at once. Slowly. The business wasn’t growing the way I had expected. What had once looked like momentum was becoming harder to sustain. The highs were exciting, but the gaps between them were telling a different story. I had built something that could generate impressive results, but I hadn’t built something that could sustain them.
Eventually, I made the difficult decision to close the business and return to a corporate career.
Looking back, the numbers weren’t necessarily wrong. They were incomplete. They captured the successes and missed the uncertainty. They showed what I had achieved, but not whether those achievements were repeatable.
I stopped looking at success as a single number. I started paying attention to the patterns beneath it. The inconsistencies. The warning signs. The small decisions that eventually shape much bigger outcomes.
The average is where you feel safe. The edge is where the truth is. And once you see it, you can’t unsee it.
02. Relationship-led work
The average client wasn’t real.
After that experience, I started noticing the same pattern inside institutions. Especially in private banking. Clients with similar financial profiles can have very different needs, behaviours, and relationship trajectories. Most dashboards flatten all of them into a single number. Decisions get made on that number.
I saw the same thing in teams. The average employee didn’t exist. One person could carry momentum for months. One misaligned person could quietly slow everything down. Performance systems smoothed both into the same band. The summary was accurate. The picture it painted was incomplete.
A model can perform well overall while missing important patterns in individual groups or unusual situations. When those systems are deployed at scale, the consequences of what they overlook can grow just as quickly as the benefits of what they get right.
Risk
Sits at the edges.
Opportunity
Sits at the edges.
Trust
Built or broken at the edges.
Same value, different stories
The moment it fully clicked.
The lesson from running my own business followed me into data and analytics. In private banking, I began to understand how powerful it could be.
When I began working on client intelligence, I thought the challenge was to build better models and produce better insights. The more we explored individual client behaviour, the clearer it became that the real challenge wasn’t simply predicting what might happen next.
It was understanding why a particular client might need attention, what their behaviour meant in the context of their relationship, and how a relationship manager could make a better decision.
We weren’t just trying to build better dashboards. We were trying to help people see what the dashboards couldn’t tell them.
Client A
$5M AUM
Growing
Actively engaging. Exploring new opportunities. The relationship is strengthening.
Client B
$5M AUM
Changing engagement
Engagement declining. Gone quiet. Declining engagement requires further investigation.
Illustrative example. On a portfolio dashboard they appear identical. Each holds five million dollars in assets under management. Their relationships tell two completely different stories.
That is what Recency, Frequency, and Monetary value (RFM), Customer Lifetime Value (CLTV), and predictive analytics are for. RFM shows how clients are behaving. CLTV estimates future value. Combined with AI, they can identify changes in behaviour and suggest a relevant next step for the relationship manager.
The real insight was not in the models. It was in what happened when we stopped treating clients as numbers and started looking at the individual relationships behind them.
A client who hasn’t traded in six months may be disengaging. Or they may simply be satisfied with a long-term investment strategy. The numbers alone can’t tell you which. You need context. You need the relationship. And you need human judgement to decide what those signals actually mean.
The model identifies a signal. The relationship manager determines what that signal means.
The purpose of analytics is not simply to tell us what is happening. It is to help us see what we would otherwise miss.
03. The Fractal Lens
Three questions. One better decision.
You don’t need a new system to think differently. You need better questions. These three have changed how I read every situation, in data, in teams, and in strategy. They are simple. They are not easy, because they require you to resist the comfort of the summary and lean into the detail.
The goal is not to investigate every exception. It is to recognise which differences matter, understand why they exist, and decide whether they deserve action. An edge raises a question. It doesn’t automatically provide the answer.
Question 01
What does the average hide?
Every average hides a distribution. The summary number is not the business. It is a compression of the business. Compressions lose information. The question is which information they lose, and whether that information matters.
When you ask “What is our average client revenue?” you get a number that is technically accurate and practically misleading. It tells you nothing about the clients pulling the average up, or down. It tells you nothing about what separates the two groups.
Ask instead:
- Who are the top outliers, and what are they doing differently?
- Who are the bottom outliers, and what do they share?
- What behaviours, segments, or decisions are driving either end?
The edges tell you what to scale, what to fix, and what to avoid.
Question 02
What happens when I zoom in?
A pattern that looks stable at a high level often breaks at higher resolution. This is the Fractal Lens: the picture changes when we examine it at a different level of detail. The shape you see from a distance is not necessarily the shape that exists up close.
We are rewarded, cognitively and organisationally, for the high-level view. It feels decisive. It feels manageable. It can be deeply misleading.
The high-level view
From altitude, the team looks productive. Revenue looks stable. Engagement looks consistent. The pattern appears clear and manageable.
The zoomed-in reality
One subgroup is overloaded. Another is underutilised. A segment is quietly disengaging. The average hid a profound imbalance.
Question 03
Where is trust being built or broken?
This is the variable most dashboards ignore. In relationship-led businesses (private banking, consulting, professional services, any context where the human connection is the product), trust is the real asset. Not revenue. Not satisfaction scores. Trust.
Trust compounds. Or it decays. It moves slowly in both directions, which makes it easy to miss on a quarterly dashboard. By the time it shows up in churn or revenue decline, it has usually been eroding for months.
Two clients, same revenue
One trusts you deeply. They refer others, they give you context, they stay through difficulty. The other is transactional, price-sensitive, and quietly interviewing competitors. The average says they are equal. Reality says they are not even close.
- Where are you over-delivering without recognition?
- Where are you silently disappointing?
- Where are relationships strengthening, or weakening?
Trust as a leading indicator
Most business metrics tell us what has already happened. Changes in trust can sometimes provide an earlier indication that a relationship is strengthening or weakening.
A client may still generate the same revenue while becoming less engaged. A team may continue meeting its targets while collaboration is quietly deteriorating. These changes may not appear immediately in financial or performance reports. Understanding them early leads to better decisions.
The decision
What will I do differently now that I can see it?
Turn the insight into an appropriate action. Finding the signal is only the beginning. This is the step that makes the lens a leadership tool. From seeing differently to deciding differently.
04. Human + math
The best decisions live in the intersection.
The best decisions are not purely analytical, and they are not purely intuitive. They sit where rigour meets judgement, where structure meets context, where the model meets the moment.
Averages help leaders see the overall picture. Edges reveal what is changing within it. The work is to move between them deliberately, knowing which resolution serves the decision in front of you.
Math gives you structure
Patterns, aggregates, and probabilities are the skeleton of understanding. They are necessary, and they are not sufficient.
Humans give you meaning
Context, nuance, and consequence are the tissue around the skeleton. They make the structure matter in a specific situation.
Together, you decide
Data without context becomes noise. Intuition without grounding becomes guesswork. The intersection is where clarity lives.
Human judgement is not the absence of evidence. It is the ability to understand evidence in context, question its limitations, and take responsibility for the decision. A relationship manager should not automatically accept an AI recommendation, and should not reject it solely because intuition suggests something different. The question is whether the recommendation makes sense for this client, this relationship, and this moment.
The AI era
This matters more now, not less.
There is a tempting narrative around AI: that better models will eventually solve the judgement problem, and that enough data will take care of the edge cases. I have spent over fifteen years building and deploying these systems. I don’t believe that narrative.
AI scales whatever thinking you bring into it. The quality of your judgement (your ability to ask the right questions, to see what the average hides, to notice the edge) becomes more important, not less.
If you think in averages
AI will amplify that thinking faster, at greater scale, and with greater confidence. The blind spot becomes a blind system.
If you miss important patterns
AI can perform well overall while missing meaningful patterns in particular groups or unusual situations. What it overlooks at scale can matter as much as what it gets right.
If you lack judgement
AI will scale poor decisions confidently, consistently, and at a volume no human team could match. The tool amplifies the operator.
The risk is not simply that AI can make mistakes. A system can perform well overall while making the wrong recommendation for a particular person or situation. When those decisions are repeated at scale, the consequences can grow before anyone notices the underlying problem.
Better models matter. So does the ability to recognise when a model’s recommendation doesn’t fit the individual situation.
Operating mode
Hold both views on purpose.
The fractal leader holds two views at once, moving between them intentionally, knowing which resolution serves the current decision.
System view
Zoom out to see the pattern.
Aggregates, trends, and overall performance. Used for direction and strategy.
Edge view
Zoom in to see what matters.
Individual behaviours, differences, and changes. Used for diagnosis and action.
Move between both views deliberately. Never confuse one for the other.
This is not a technique. It is a disposition, a way of engaging with information that refuses to accept the summary as the whole story. I didn’t learn it from theory. I learned it from getting it wrong when it mattered, and watching what it cost.
05. What to do next
The decision is yours.
The next time a dashboard tells you everything is fine, don’t stop there.
One decision. Four questions.
- 01
What is the overall picture telling me?
Understand the summary before questioning it. The average is not the enemy. Complacency about the average is.
- 02
What changes when I look at the individual parts?
Identify meaningful patterns and differences. Break it by segment. Look at the top and bottom contributors.
- 03
What human context am I missing?
Understand the people, relationships, and circumstances behind the data. Ask where trust is moving.
- 04
What will I do differently?
Use what you have discovered to make a more informed decision. That alone will change how you see things.
Ask what the numbers represent. Look at the people, behaviours, and decisions behind them. Find the differences that matter. Understand the context. Then decide what to do.
Leadership is not about having the most complete dashboard or the most sophisticated AI. It is about seeing clearly enough to make the decisions that matter.
Zoom out to see the system. Zoom in to see what matters. And never confuse the summary with the whole story.
Conversation
If you want to go deeper.
I’m open to a real conversation. No pitch. No deck. Give me thirty minutes on where averages might be misleading you, in your team, your clients, or your decisions.
ahmedmzl@gmail.com